La Quinta vs Palm Desert, CA: Buyer Guide
Compare La Quinta and Palm Desert with fresh September 2026 MLS data, interactive city and area comparisons, monthly sales charts, and practical home-buying insights.

- The new MLS comparison covers 2,761 closed homes: September 2025–August 2026, with active and pending listings from the September 4, 2026 export.
- La Quinta’s median sold price was $825,000; Palm Desert’s was $560,000. Palm Desert’s larger condo/townhouse share makes home-type filters essential.
- Your budget can change the story: among MLS single-family sales over $500,000 through $750,000, both cities had a median year built of 2000, and Palm Desert’s median home was larger.
- Compare the area as well as the city: South Palm Desert had a higher median sold price per square foot than La Quinta south of Highway 111, despite a lower total median price.
- Explore the numbers below: filter by home type, price band and MLS area, switch between sold and listed homes, or inspect monthly closings.
La Quinta and Palm Desert can both work for a full-time home, a seasonal retreat or a simpler desert lifestyle. The useful question is what your budget buys in the places you would actually enjoy living. This guide combines the latest supplied MLS export with the neighborhood, mountain-setting and daily-life differences that matter on a home tour.
Explore La Quinta vs Palm Desert home data
Start with both cities, then choose the home type and price band you would shop. The MLS areas view helps you see differences within each city; Monthly sales shows how the number and mix of closings changed through the year. Every view uses the same supplied export.
Then compare the cities.
Start with the same price range and home type. Explore sold prices, available inventory and the MLS areas behind the citywide numbers.
Closed sales: Sep 2025–Aug 2026 · Listings: Sep 4, 2026Closed September 2025–August 2026 · All homes · All prices
- Median $ / sq ft
- $384
- Median size · sq ft
- 2,324
- Median days on market
- 511079 reported values
- Median year built
- 2001
- Median $ / sq ft
- $3211676 reported values
- Median size · sq ft
- 1,8081676 reported values
- Median days on market
- 531670 reported values
- Median year built
- 19891676 reported values
Bars show relative values within each measure. Price per square foot is calculated for each home before taking the median.
Broad MLS areas help explain the mix of homes. These are listing-system labels, not neighborhood or municipal boundary maps. All areas below use your market, home-type and price filters.
Monthly closing counts show activity within your filters. Monthly median prices are listed below; changes can reflect a different mix of homes, especially in small samples.
See exact monthly counts and median sold prices
Source: Mark’s September 4, 2026 MLS export. Showing September 2025–August 2026. Medians require at least five valid reported values. Fewer than 10 homes is a very small sample; fewer than 30 is a limited sample.
How to read this comparison
City follows the MLS City field, so Palm Desert includes Sun City mailing-city records. MLS single-family does not guarantee detached construction. “Manufactured on land” uses the MLS designation; this residential export is not a complete mobile or manufactured-home inventory. All homes includes one closed record with unresolved single-family/condo classification.
Sold price is used for closed sales; asking price is used for active and pending listings. Pending prices are not final sale prices. Active and pending are the September 4 snapshot; the sales-period filter applies only to closings. Price bands have no overlap: for example, the $500k–$750k band is over $500,000 through $750,000. Medians are rounded for display.
Duplicate records and atypical co-ownership, timeshare, duplex, quadruplex and unknown-subtype records were excluded. This comparison describes the supplied export; it is not a complete inventory audit, a same-home appreciation index or a property valuation. Days on market and home characteristics reflect valid reported MLS values.
What the fresh MLS data means for buyers
The citywide price gap is a starting point
La Quinta recorded 1,084 included closings at a median of $825,000, compared with 1,677 at $560,000 in Palm Desert. But the cities sold different mixes of homes: condos and townhouses represented about 18% of La Quinta closings and 43% of Palm Desert closings.
Filtering to the MLS single-family category brings the medians to $900,000 in La Quinta and $633,000 in Palm Desert. For condos and townhouses, they were $705,000 and $480,000. The gap remains, but neither comparison holds the neighborhood, size, condition, lot or view constant.
At the same budget, the comparison becomes more useful
Over $500,000 through $750,000 · MLS single-family · 12-month closings
La Quinta
$615,000
Median sold price · 255 homes
Median size: 1,852 sq ft
Median year built: 2000
Palm Desert
$600,000
Median sold price · 371 homes
Median size: 2,029 sq ft
Median year built: 2000
Within this bracket, Palm Desert’s median home was 177 square feet larger and both cities had the same median year built. “La Quinta is newer” is a useful citywide observation that does not automatically carry over to your budget.
This is still a comparison of groups of homes. Use it to decide what to tour, then compare individual properties for layout, renovation quality, usable outdoor space and recurring costs.
Palm Desert offered more choices at $500,000 or less
The September 4 snapshot contained 255 included active Palm Desert listings at $500,000 or less, versus 65 in La Quinta. That count includes the available home types in the export. Set the home-type filter before assuming those choices match what you want to buy.
Median reported days on market for closed homes were close—51 in La Quinta and 53 in Palm Desert. A two-day difference is not a strong reason to favor one city. An individual home’s pricing, condition and competition will matter much more.
La Quinta: compare north and south of Highway 111
La Quinta’s mountain setting and resort communities are a large part of its appeal. Its citywide closed-home median year built was 2001, and roughly 58% of included sales were built in 2000 or later. That broad profile includes substantial differences between communities.
North of Highway 111
123 closings · $609,995 median
The northern MLS area had a median sold price of about $610,000 and a median year built of 1999. It is a useful starting point when the broader La Quinta median appears above your budget.
South of Highway 111
956 closings · $923,000 median
This large MLS area includes very different housing settings. Its median year built was 2001, but a city-side label cannot tell you whether a particular home is a remodeled older property or a more recent build.
For a closer look, compare the La Quinta Cove and PGA West guides. Their neighborhood identities help explain why “South La Quinta” is too broad to be the final buying decision. Another five closings had unclassified or conflicting MLS-area labels and remain in the city total.
Palm Desert: the area changes the housing story
Palm Desert’s overall median year built was 1989, but its established southern neighborhoods and newer northeastern inventory should not be treated as the same housing market. Use the explorer to compare the following MLS groups at your budget and home type.
- South Palm Desert: 359 closings, a $795,000 median sold price and a median year built of 1977. About 71% of this group was built before 1980. Original age makes renovation history and current condition especially useful tour questions.
- East Palm Desert: 584 closings at a $509,500 median, with a median year built of 1988. This was the largest Palm Desert area group in the export.
- North Palm Desert: 385 closings at a $595,000 median and a median year built of 1989. About 40% were built in 2000 or later, illustrating how a single median can hide a varied age mix.
- Northeast Palm Desert: 279 closings at a $520,000 median and a median year built of 2000. It is kept separate from North Palm Desert in the explorer.
- Sun City MLS area: 38 closings at a $589,750 median. These records retain their own source-area group; this is not a complete community sales report.
City names follow the export’s MLS City field, including mailing-city usage. MLS areas are source groupings, not verified municipal or community boundaries. Another 32 Palm Desert closings have unclassified or conflicting area labels and are included in the city total.
South Palm Desert vs South La Quinta: price per square foot tells another story
South Palm Desert’s median total sold price was lower—$795,000 versus $923,000 south of Highway 111 in La Quinta. Yet its median individual sold price per square foot was higher: about $424 versus $404. The area with the lower total price was not the lower-priced area on this measure.
Neither number identifies the better home for you. They show why total price, floor area, neighborhood and condition belong in the same conversation. In the explorer, select the two southern areas and narrow the property type to make the comparison more relevant.
Daily life: Old Town La Quinta vs El Paseo
Old Town La Quinta
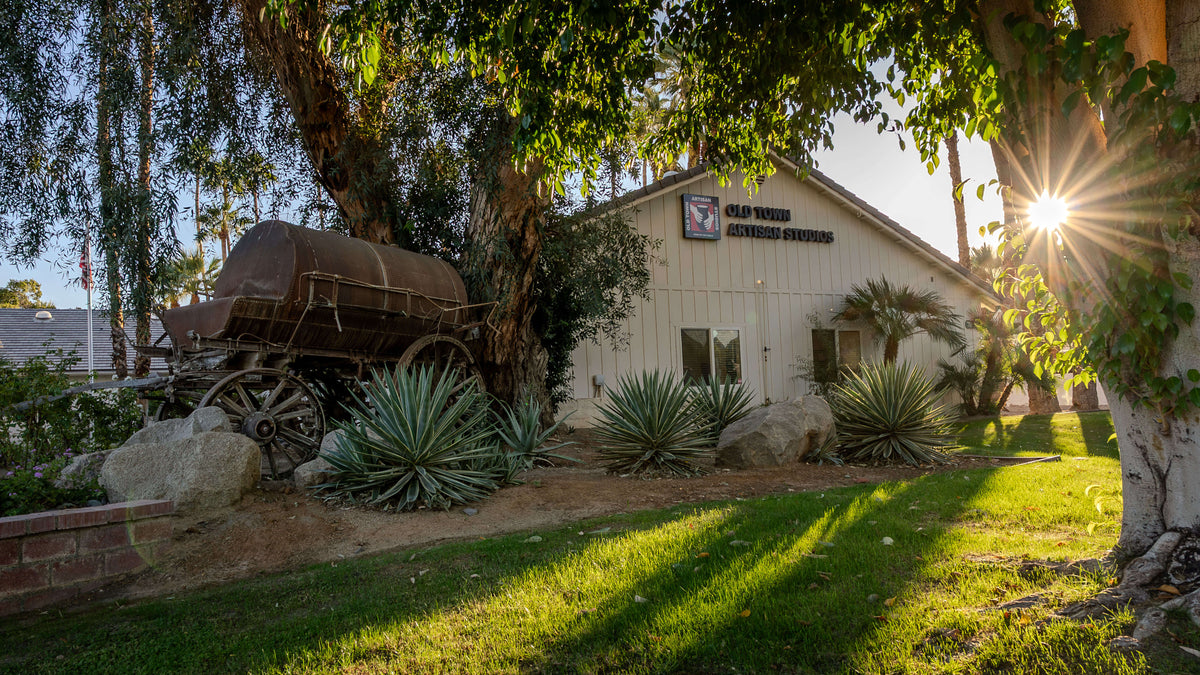
A compact gathering place near the mountains, with restaurants, boutiques and services. Its official directory is a useful starting point for planning a walk and seeing whether its village atmosphere fits your routine.
Try it on a tour: pair neighborhood showings with coffee or dinner in Old Town, then drive the route back to the homes you liked.
El Paseo in Palm Desert
A shopping, dining and gallery district that gives South Palm Desert a distinct center of activity. Discover Palm Desert describes its restaurants, galleries and public art; our El Paseo guide adds local context.
Try it on a tour: visit at the time of day you would normally go out, then check the drive from each candidate neighborhood.
For a change of scenery, Highway 74 offers a route from Palm Desert toward the mountains. The federal Palms to Pines Scenic Byway guide describes the transition from desert landscapes into the Santa Rosa and San Jacinto Mountains. For everyday living, the more revealing test is still your own drive to groceries, appointments, recreation and friends.
Mountain setting, wind and the individual lot
The San Gorgonio Pass helps explain the valley’s regional wind patterns. NASA describes mountain passes as natural wind tunnels. That geography is useful context, but it does not measure wind at a particular home.
In local buyer comparisons, much of La Quinta and mountain-adjacent South Palm Desert can feel more sheltered than exposed northern settings. Treat that as a general observation. Outdoor comfort still depends on the lot, patio orientation, walls, landscaping, nearby open land and the weather that day.
Visit the patio during a breezy afternoon. Spend a few minutes where you would actually sit, open the doors you expect to use and consider afternoon sun as well as wind. A city label cannot replace that experience.
Turn the comparison into a better home tour
- Set the same buying criteria for both cities. Start with your price band and MLS home type. Confirm the actual building configuration on any home you shortlist; MLS single-family does not always mean physically detached.
- Narrow to areas that fit your routine. Use the city and area comparisons to choose a manageable shortlist, then test real driving routes and the places you expect to visit most.
- Compare the home’s current condition. Construction year is a starting point. Ask about roof, cooling system, windows, pool equipment and renovation history rather than assuming newer always means less work.
- Check the community details before deciding. Confirm what reported HOA dues cover, any separate club costs, and the current rules relevant to your intended use with the listing and governing documents.
- Tour the outdoor space deliberately. Compare privacy, shade, views, usable patio area and comfort at the same time of day.
If you want a mountain-oriented setting and La Quinta’s community options, begin there. If a wider range of lower-priced options or Palm Desert’s everyday destinations fit your plans, begin there. The fresh data gives you a stronger shortlist; the individual home and neighborhood determine the final fit.
La Quinta vs Palm Desert: FAQs
Is La Quinta more expensive than Palm Desert?
In the supplied September 2025–August 2026 closed-sale data, La Quinta’s median was $825,000 and Palm Desert’s was $560,000. The housing mix differs: condos and townhouses made up about 18% and 43% of closings, respectively. Filter by home type, budget and area before drawing a conclusion about an individual home.
Which city offers newer homes at the same budget?
Citywide, La Quinta’s median year built was 2001 and Palm Desert’s was 1989. But among MLS single-family sales over $500,000 through $750,000, both cities had a median year built of 2000. Construction year also does not measure current condition or renovation quality.
Which city has more homes at $500,000 or less?
The September 4, 2026 export snapshot contained 255 included active Palm Desert listings at $500,000 or less, compared with 65 in La Quinta. Those counts combine home types and are not a live availability feed. Use the home-type filter and confirm availability in the current listing search.
Is La Quinta less windy than Palm Desert?
Much of La Quinta and mountain-adjacent South Palm Desert can feel more sheltered than exposed northern settings, based on general local observations. Wind varies by neighborhood, lot orientation and weather. Visit the outdoor space during a breezy afternoon rather than treating a citywide comparison as a guarantee.
How should I compare South Palm Desert with South La Quinta?
In the 12-month data, South Palm Desert’s median sold price was $795,000 versus $923,000 in La Quinta south of Highway 111. Its median individual sold price per square foot was higher, about $424 versus $404. Compare the same home type and budget, then weigh condition, layout, lot, community costs and everyday destinations.
Sources & market-data notes
MLS source and dates: user-supplied residential export textexport - 2026-09-04T221341.258.csv, 4,700 rows, snapshot September 4, 2026. Primary closed sales: September 1, 2025–August 31, 2026. Recent closed sales: March 1–August 31, 2026. Active and pending counts use the export snapshot. The original search scope and completeness cannot be independently verified, so these figures describe the supplied records.
Included homes: MLS single-family, condominium/townhouse and manufactured-on-land records, plus one retained transaction with unresolved single-family/condo classification. Single-family is an MLS label, not a guarantee that a home is physically detached. Manufactured-on-land coverage is thin and should not be treated as a complete manufactured housing survey.
Duplicate and atypical records: four repeated-home rows were removed across the full export after matching property and transaction information. For the active duplicate, the most recently modified record was retained. Twenty-three atypical records were excluded: 16 co-ownership, two timeshare, one duplex, one quadruplex and three unknown subtypes. One duplicated closing with conflicting single-family/condo labels is counted once in All homes and excluded from both specific type filters. The final 12-month comparison contains 1,084 La Quinta and 1,677 Palm Desert closings; active counts are 352 and 609, and pending counts are 35 and 55.
Prices, budgets and medians: closed sales use sold price; active and pending records use asking price. Budget bands do not overlap: $500,000 or less; over $500,000 through $750,000; over $750,000 through $1 million; over $1 million through $2 million; and over $2 million. Price per square foot is the median of individual valid price-to-size ratios, not median price divided by median size. A median size or construction year describes that field’s middle value, not a single representative property.
Missing values and sample size: negative days-on-market values are unavailable for that metric; zero is valid. One zero-square-foot record is excluded from size and price-per-square-foot calculations. Medians require at least five valid observations. Counts remain visible, with warnings for fewer than 10 homes and 10–29 homes. Year-built percentages use available year-built values. No listing addresses, MLS numbers, parcel numbers, remarks or contact details are embedded in the explorer.
Geography: City follows the MLS City field, including mailing-city usage. Area labels are normalized from the export, with North Palm Desert, Northeast Palm Desert and Sun City kept separate. Unknown or conflicting labels stay in their own group. Every area subtotal reconciles to its city total. These are MLS groupings, not verified municipal or community boundaries or complete community reports.
Reading the history: monthly charts include complete calendar months. Changes in median prices can reflect a changing mix of homes, not like-for-like appreciation. The six- and 12-month windows overlap. Earlier figures from the original May 2026 article used a different period and are replaced here; comparing them directly would not establish a price trend.
Lifestyle and geography references: the following sources support the surrounding context. Wind comments are general local observations, not a parcel-specific weather assessment.
- NASA Earth Observatory — Wind Farm in San Gorgonio Pass: regional mountain-pass wind geography.
- Old Town La Quinta: dining, shopping and local services.
- Discover Palm Desert — El Paseo: dining, galleries and public art.
- Recreation.gov — Palms to Pines Scenic Byway: the desert-to-mountain route.