








When the Desert Floor Sinks: Coachella Valley Subsidence
How groundwater changes the land beneath us—and why the story includes recovery.

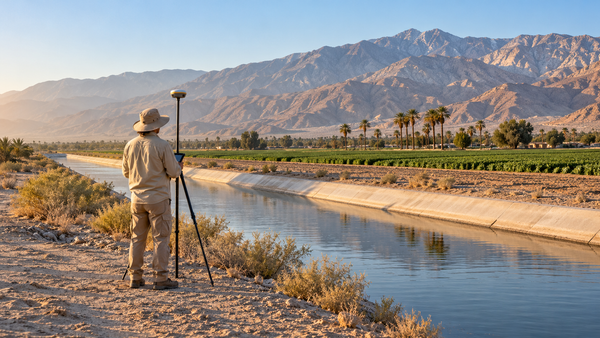
A canal can look almost level and still depend on a carefully designed slope. Change the ground beneath it unevenly, and the water may no longer move as intended. That is one reason a slow shift in the desert floor matters.
In parts of the Coachella Valley, researchers have measured land settling as groundwater levels fell. The process is called land subsidence. But the local record also contains a less familiar development: groundwater recovery, slower settling and, in some places, a small upward movement of the surface.
The story connects what we pump, what we put back underground and the sediments supporting the places we know.
- Groundwater decline can compress susceptible sediments and lower the land surface.
- The largest historical measurements were local—not a uniform drop across the valley.
- Recharge and reduced pumping helped improve conditions; dated observations and ongoing monitoring matter.
This is different from being below sea level
Our guide to why parts of the Coachella Valley are below sea level looks at the region’s basin and its long geologic history. Subsidence asks a different question: has this piece of ground changed height through time?
A negative elevation is a position. Subsidence is movement. One reading cannot tell you the other, and high ground can subside too.
How can pumping water lower solid ground?
Much groundwater is stored in pores between grains of sediment. Water pressure supports part of the load above; the grains support the rest. Lower that pressure and more load transfers to the sediment framework.
Some of the resulting compression is elastic: the material can expand again when pressure returns. But when stress exceeds what susceptible sediments have previously experienced, grains can rearrange and pore space can be lost permanently. Refilling does not necessarily restore the original storage space or surface height. [3]
What researchers actually measured here
A 2014 USGS summary reported about nine inches to two feet of subsidence in some areas of Palm Desert, Indian Wells and La Quinta during 1995–2010. Most of the valley was relatively stable. Those figures describe particular areas over fifteen years; they are neither a valley-wide average nor a present-day annual rate. [1]
The 2020 USGS follow-up showed a changing pattern. Its comparison of GPS surveys in 2010 and 2015 found 17 of 24 monuments stable, three subsiding and four rising. Satellite radar for December 28, 2014–June 27, 2017 measured as much as about 80 millimeters of subsidence in the La Quinta area and about 60 millimeters of uplift near the Whitewater River Groundwater Replenishment Facility. These are different locations and measurement periods, not opposing measurements of the same spot.
Compared with the earlier period, subsidence had generally slowed substantially. The useful headline is improvement with local differences—not that every location stopped moving. [2]
Why one area responds differently from another
The ground beneath the valley is a varied stack of gravel, sand, silt and clay, including material deposited by streams and former lakes. Fine-grained, compressible layers are not distributed evenly. Differences in those layers help explain why neighboring areas can respond differently to pressure changes.
Timing matters too. Water moves slowly through thick clay layers. They may continue compacting while water levels in more permeable material have already stabilized or risen. Researchers describe this as residual compaction. [4]
Why a slow change matters to canals and roads
Uneven movement changes gradients and puts connected structures under strain. A canal needs both a workable slope and enough distance between the water surface and the top of its lining.
The 2020 research account describes subsidence-related sags along the Coachella Canal that affected flow and reduced that margin, called freeboard. It reports that CVWD realigned a portion in 2014. The concern is practical: keeping water moving through infrastructure laid across a changing surface. [4]
What helped change the trend?
There are three complementary ways to reduce pressure on groundwater: use less water, replace some pumping with another supply, and replenish the aquifer. Local programs used all three.
CVWD’s recharge basins let water soak underground. The district identifies four active facilities: Whitewater River, Mission Creek, Palm Desert and Thomas E. Levy. Imported supplies and local runoff support replenishment; the water available in any year still matters.
Substitution works differently. Supplying an irrigation user with canal water or recycled water can reduce the groundwater that otherwise would be pumped. Recharge adds water to the system; substitution avoids some withdrawal. [5]
For the wider supply picture, read where the Coachella Valley’s water comes from and the history of the Coachella Canal.
What does the newer monitoring tell us?
The Indio Subbasin’s annual report for water year 2024–2025, issued with a March 2026 final cover, reports that all 57 Key Wells remained above their assigned minimum groundwater-level thresholds.
Those thresholds matter because the agencies use groundwater levels as a proxy for potential subsidence, as well as for other groundwater concerns. The result is encouraging evidence about the basin’s monitored groundwater conditions.
It is not the same thing as a new, direct elevation survey at every home, street or canal. The report’s subsidence section combines this proxy assessment with older measurements and continued monitoring plans. A recent publication date does not make every land-movement measurement inside it a 2025 measurement. [6]
That distinction lets us acknowledge progress without declaring the problem permanently solved. Maintaining groundwater conditions and measuring the land remain part of the same job.
How do you measure something so hard to see?
Survey measurements track elevation at specific points. Satellite radar interferometry—usually shortened to InSAR—compares radar observations across time to map deformation over broader areas. Researchers compare those results with groundwater levels and geology.
The methods complement each other. A point survey provides a local measurement; a satellite pattern reveals how movement varies across a landscape. Neither should be confused with reading an elevation once on a phone. [7]
A different way to read the desert landscape
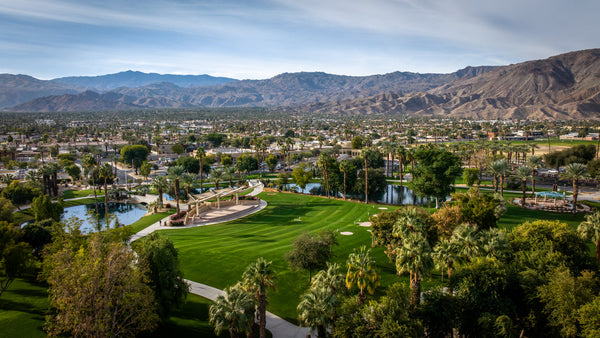
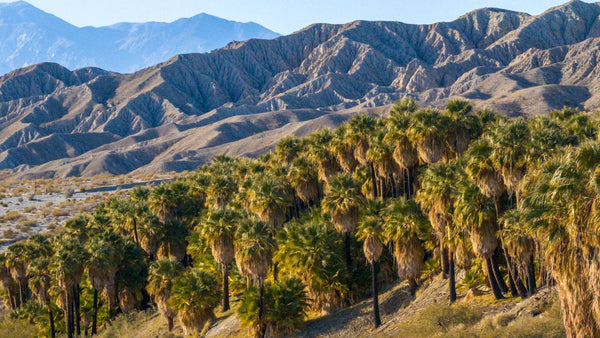
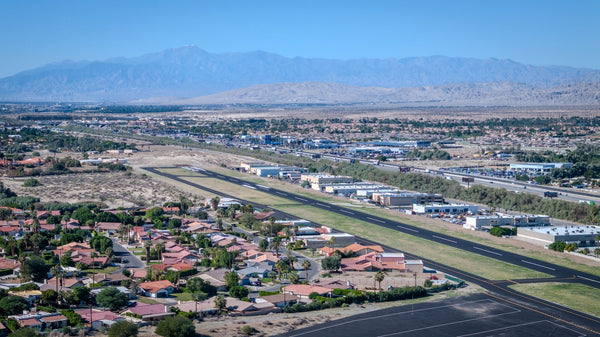
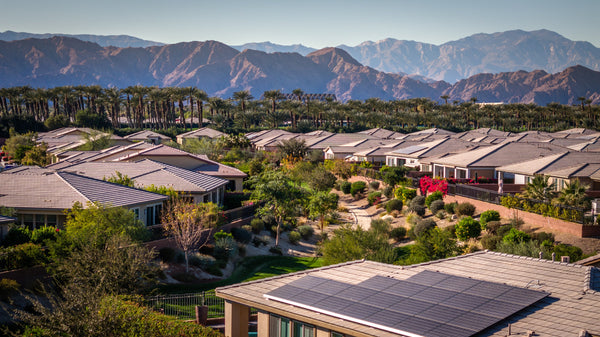
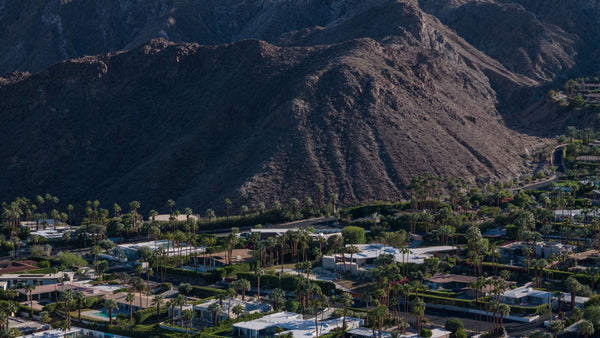
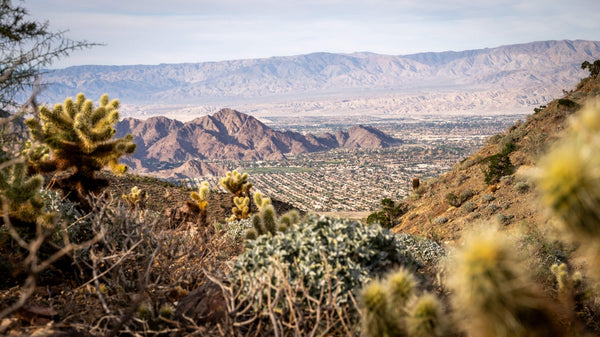
From the Santa Rosa Mountains, the developed valley can appear like one continuous plain. At ground level, we notice roads, homes, fields and waterways. Subsidence adds another layer to that view: the condition of the sediments underneath.
A photograph can show a canal, a monitoring instrument or the transition from foothills to valley floor. It cannot, by itself, prove that a crack came from groundwater withdrawal. A single damaged curb is not a subsidence measurement.
The Coachella Valley’s record is more useful than either a catastrophe story or a claim that there is nothing left to watch. It shows that groundwater management can change the trend—and that the ground’s response deserves to be measured.
Questions about Coachella Valley subsidence
Is the entire Coachella Valley sinking?
No. Published measurements show substantial differences among locations and periods, including stable areas and some uplift. Historical maximums should not be applied to the whole valley.
Is subsidence the reason parts of the valley are below sea level?
Not by itself. The regional basin has a much longer geologic history. Modern groundwater-related subsidence describes changes in land elevation over time.
Can groundwater recharge lift the land back up?
Some elastic deformation can reverse as pressure recovers. Permanent compaction does not simply disappear, and slowly draining layers can respond later than surrounding aquifers.
Does a crack in a driveway prove subsidence?
No. A photograph or one crack cannot establish its cause. Regional monitoring is not a diagnosis of a particular structure or parcel.
Do the 2025 groundwater results prove there is no land movement?
No. The annual report says all 57 Key Wells were above their groundwater-level minimum thresholds. Those levels serve as a subsidence proxy; they are not direct measurements of every point on the surface.
Sources, measurement dates and image notes
Research checked October 27, 2026. Observation periods are identified in the article; historical measurements are not presented as current rates.
- USGS, Land-Subsidence Trends in the Coachella Valley Detailed in New Report (June 10, 2014). Historical 1995–2010 measurements and infrastructure implications.
- Sneed and Brandt, USGS Scientific Investigations Report 2020–5093 (2020). GPS and InSAR observations through 2017; measurement periods and mixed responses.
- USGS Circular 1186, Effect of groundwater development on groundwater storage (1999). Pore pressure, effective stress and irreversible compaction.
- Sneed and Brandt, Mitigating Land Subsidence in the Coachella Valley (2020). Local sediment differences, delayed compaction, canal effects and the management response. Open access, CC BY 4.0.
- CVWD, Groundwater Replenishment and Imported Water. How imported water, recharge and nonpotable supplies support the basin; checked October 27, 2026.
- Indio Subbasin Groundwater Sustainability Agencies, Annual Report for Water Year 2024–2025 (final cover: March 2026). Executive summary ES-2 and ES-5; Section 3.4, printed page 3-11. All 57 Key Wells above their minimum thresholds; groundwater levels are used as a proxy for subsidence.
- USGS, Water Availability and Land Subsidence in California (2018). Why researchers combine GPS, satellite radar, groundwater measurements and geology.
- USGS Water Science School, Land Subsidence. General explanation of groundwater withdrawal, grain compaction and loss of pore space.
Images: The featured scene is an AI-generated editorial illustration of a fictional field survey, not an actual USGS or CVWD project, specific canal reach or measured damage. It is a temporary placeholder pending original photography. The interactive cross-section is an original conceptual diagram, not measured subsurface geometry.


